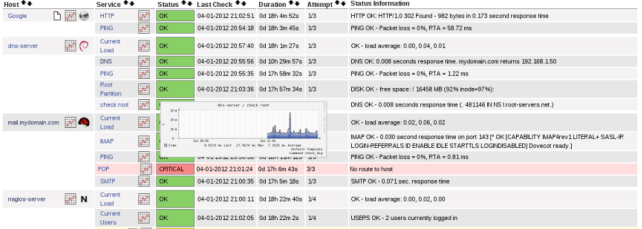
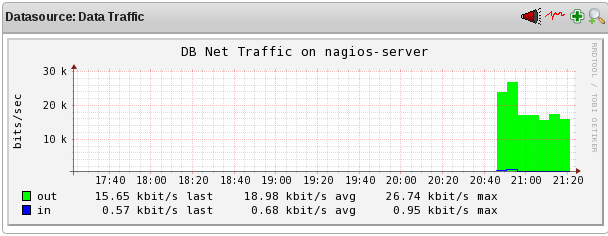
Nagvis is an Addon for nagios that allow create our own maps with the nagios information services. The classical method to collect services data from Nagios is reading the file status.dat, this file is updated every 10 seconds by default defined on the entry status_update_interval in nagios.cfg. Mk livestatus is a module loaded with Nagios that send all status update over UNIX socket and create SQL sentences. Mk livestatus it’s very popular in the developer of addons, is very easy to read data from this process and the information is actually not updated every 10. Nagvis uses live status for read information about hosts and services.
– Installing mk livestatus:
1.- Install dependencies:
# yum install make gcc-c++ wget
2.- Download mk livestatus:
# cd /tmp && wget http://mathias-kettner.de/download/mk-livestatus-1.1.12p7.tar.gz
3.- Extract package:
# tar -xzvf mk-livestatus-1.1.12p7.tar.gz
4.- Install:
# cd mk-livestatus-1.1.12p7/ && ./configure
# make && make install
5.- Create new directory with correct permissions:
# mkdir /usr/lib/nagios/mk-livestatus && chown nagios:apache /usr/lib/nagios/mk-livestatus
6.- Edit /etc/nagios/nagios.cfg :
broker_module=/usr/local/lib/mk-livestatus/livestatus.o /usr/lib/nagios/mk-livestatus/live
7.- Restart Nagios:
# service nagios restart
8.- Try command line:
# echo 'GET hosts' | unixcat /usr/lib/nagios/mk-livestatus/live
For more information of query syntax:
http://mathias-kettner.de/checkmk_livestatus.html
Configuring Nagvis
1.- Install dependencies:
# yum install php-mbstring php-gd php-pdo graphviz rsync
2.- Download Nagvis:
# cd /tmp && wget http://sourceforge.net/projects/nagvis/files/NagVis%201.6/nagvis-1.6.4.tar.gz/download
3.- Extract package:
# tar -xzvf nagvis-1.6.4.tar.gz
4.- Installing Nagvis:
cd nagvis-1.6.4/ && ./install.sh
+--- Checking paths -----------------------------------------------------------+
| Please enter the path to the nagios base directory [/usr/sbin/nagios]: /etc/nagios
| Please enter the path to NagVis base [/usr/sbin/nagvis]: /usr/share/nagvis
| Do you want to use backend mklivestatus? [y]:y
| Livestatus Socket (/etc/nagios/var/rw/live) MISSING |
| Valid socket formats are: tcp:127.0.0.1:7668 or unix:/path/to/live |
| Please enter your MKLivestatus socket: unix:/usr/lib/nagios/mk-livestatus/live
5.-Edit /usr/sbin/nagvis/etc/nagvis.ini.php:
[defaults]
; default backend (id of the default backend)
backend="live_1"
[backend_live_1]
backendtype="mklivestatus"
socket="unix:/usr/lib/nagios/mk-livestatus/live"
6.- Reload apache:
# service httpd reload
7.- Access http://192.168.1.68/nagvis :
Default user and password admin // admin
Configuring PNP4Nagios
pnp4nagios is an addon for Nagios that can build graphs based in rrdtool like cacti of hosts and services checks that produce Nagios. We can configure pnpp4nagios in some modes, here i’ll explain how to configure with bulk mode, basically this mode reduce the use of cpu because the process is not called for every service/host check. For more information see:
http://docs.pnp4nagios.org/pnp-0.6/config
1.- Installing pnp4nagios:
# yum install pnp4nagios
2.- Edit /etc/nagios/nagios.cfg:
process_performance_data=1
# *** the template definition differs from the one in the original nagios.cfg
service_perfdata_file=/var/log/pnp4nagios/service-perfdata
service_perfdata_file_template=DATATYPE::
SERVICEPERFDATAtTIMET::$TIMET$tHOSTNAME::
$HOSTNAME$tSERVICEDESC::
$SERVICEDESC$tSERVICEPERFDATA::
$SERVICEPERFDATA$tSERVICECHECKCOMMAND::
$SERVICECHECKCOMMAND$tHOSTSTATE::
$HOSTSTATE$tHOSTSTATETYPE::
$HOSTSTATETYPE$tSERVICESTATE::
$SERVICESTATE$tSERVICESTATETYPE::
$SERVICESTATETYPE$
service_perfdata_file_mode=a
service_perfdata_file_processing_interval=15
service_perfdata_file_processing_command=process-service-perfdata-file
# *** the template definition differs from the one in the original nagios.cfg
#
host_perfdata_file=/var/log/pnp4nagios/host-perfdata
host_perfdata_file_template=DATATYPE::HOSTPERFDATAtTIMET::
$TIMET$tHOSTNAME::$HOSTNAME$tHOSTPERFDATA::
$HOSTPERFDATA$tHOSTCHECKCOMMAND::
$HOSTCHECKCOMMAND$tHOSTSTATE::
$HOSTSTATE$tHOSTSTATETYPE::$HOSTSTATETYPE$
host_perfdata_file_mode=a
host_perfdata_file_processing_interval=15
host_perfdata_file_processing_command=process-host-perfdata-file
3.- Edit /etc/nagios/objects/commands.cfg:
define command{
command_name process-service-perfdata-file
command_line /usr/libexec/pnp4nagios/process_perfdata.pl --bulk=/var/log/pnp4nagios/service-perfdata
}
define command{
command_name process-host-perfdata-file
command_line /usr/libexec/pnp4nagios/process_perfdata.pl --bulk=/var/log/pnp4nagios/host-perfdata
}
4.- Restart Nagios
# service nagios restart
5.- Verify configuration:
# cd /tmp ; wget http://verify.pnp4nagios.org/verify_pnp_config && perl verify_pnp_config --mode bulk --config=/etc/nagios/nagios.cfg --pnpcfg=/etc/pnp4nagios
PNP4Nagios popups for Nagios
1.- Copy the status-header javascript of pnp4nagios to nagios:
# cp /usr/share/doc/pnp4nagios-0.6.16/contrib/ssi/status-header.ssi /usr/share/nagios/html/ssi/
2.- Add a new template to use and apply to hosts and services to show graph popup defined in the entry action_url:
# vi /etc/nagios/objects/templates.cfg
define host{
name host-pnp
action_url /pnp4nagios/graph?host=$HOSTNAME$&srv=_HOST_' class='tips' rel='/pnp4nagios/popup?host=$HOSTNAME$&srv=_HOST_
}
define service{
name service-pnp
action_url /pnp4nagios/graph?host=$HOSTNAME$&srv=$SERVICEDESC$' class='tips' rel='/pnp4nagios/popup?host=$HOSTNAME$&srv=$SERVICEDESC$
}
3.- Restart Nagios
# service nagios restart
Adding new services to graph for PNP4Nagios
Now I’ll add a script that will generate the number of SQL queries of a MySQL server and PNP4Nagios will graph the queries statistics.
1.- Installing dependencies:
# yum install perl-Class-DBI-mysql
2.- Download Scripts:
http://exchange.nagios.org/components/com_mtree/attachment.php?link_id=174&cf_id=30
http://exchange.nagios.org/components/com_mtree/attachment.php?link_id=174&cf_id=36
3.- Adding new command and internal variable to nagios:
#vi /etc/nagios/objects/commands.cfg
define command{
command_name check_mysqld
command_line $USER1$/check_mysqld.pl -H $HOSTADDRESS$ -u nagios -p $USER7$ -a uptime,threads_connected,questions,slow_queries,open_tables -w ',,,,' -c ',,,,' -A $USER21$
}
– Edit /etc/nagios/private/resource.cfg and add:
$USER7$=nagios
$USER21$='com_select,com_update,com_insert,com_insert_select,
com_commit,com_delete,com_rollback,aborted_clients,
aborted_connects,binlog_cache_disk_use,binlog_cache_use,
bytes_received,bytes_sent,connections,created_tmp_disk_tables,
created_tmp_files,created_tmp_tables,delayed_errors,
delayed_insert_threads,delayed_writes,handler_update,handler_write,
handler_delete,handler_read_first,handler_read_key,
handler_read_next,handler_read_prev,handler_read_rnd,
handler_read_rnd_next,key_blocks_not_flushed,
key_blocks_unused,key_blocks_used,key_read_requests,key_reads,
key_write_requests,key_writes,max_used_connections,
not_flushed_delayed_rows,open_files,open_streams,open_tables,
opened_tables,prepared_stmt_count,qcache_free_blocks,
qcache_free_memory,qcache_hits,qcache_inserts,
qcache_lowmem_prunes,qcache_not_cached,
qcache_queries_in_cache,qcache_total_blocks,questions,
select_full_join,select_rangle_check,slow_launch_threads,
slow_queries,table_locks_immediate,table_locks_waited,
threads_cached,threads_connected,threads_created,
threads_running'
4.- Edit /etc/nagios/objects/localhost.cfg
define service {
use local-service,service-pnp
hostgroup_name nagios-pool
service_description MYSQLD
check_command check_mysqld!nagios!nagios
}
5.- Copy script file and php template for pnp4nagios:
– create file /etc/pnp4nagios/check_commands/check_mysqld.cfg and add:
# vi /etc/pnp4nagios/check_commands/check_mysqld.cfg
# Adjust the whole RRD Database
DATATYPE = COUNTER
– copy the script in perl in the default plugin directory for nagios (/usr/lib/nagios/plugins):
/usr/lib/nagios/plugins/check_mysqld.pl
 # chmod 755 /usr/lib/nagios/plugins/check_mysqld.pl
# chgrp nagios /usr/lib/nagios/plugins/check_mysqld.pl
– Copy the php script for generate data for rrdtool graphs:
/usr/share/nagios/html/pnp4nagios/templates.dist/check_mysqld.php
For more information to create custom templates for pnp4nagios, see:
http://docs.pnp4nagios.org/pnp-0.6/tpl_custom


i got this
XML file “/usr/local/pnp4nagios/var/perfdata/server1/mysqld.xml” not found.
Hi!
There are something wrong with the configuration of pnp4nagios, the directory by default that it save the xml files for graph data is /var/lib/pnp4nagios/server1/mysqld.xml, check that exists and your pnp4nagios configuration.
thanks for the answer ivanmp91!
the file no exist in server, i try to graph with this http://exchange.nagios.org/directory/Plugins/Databases/MySQL/check_mysqld/details
all others my defaults graph work perfectly, this is the first template that i want to add and not work 🙁
If you know of any errors that may be committing give me notice
thanks!
leonel
You installed the plugin from the source or repository? Try to change the directory in the configuration files for pnp4nagios begin with /usr/local/pnp4nagios. If you have any output from the log files that has relevant information post it and I’ll try to help you.
the directory is usr/local/pnp4nagios , i compiled from source pnp4nagios-0.6.18 , whitout prefix, i use default,
in nagios.log i got this
[1346424396] EXTERNAL COMMAND: DISABLE_SVC_NOTIFICATIONS;server1;mysqld
[1346424411] EXTERNAL COMMAND: SCHEDULE_FORCED_SVC_CHECK;server1;mysqld;1346424410
[1346424415] EXTERNAL COMMAND: SCHEDULE_FORCED_SVC_CHECK;server1;mysqld;1346424414
[1346424419] SERVICE ALERT: server1;mysqld;CRITICAL;SOFT;1;Alarm at 20
[1346424419] SERVICE ALERT: server1;mysqld;CRITICAL;SOFT;2;Alarm at 20
[1346424419] EXTERNAL COMMAND: SCHEDULE_FORCED_SVC_CHECK;server1;mysqld;1346424418
[1346424429] SERVICE ALERT: server1;mysqld;CRITICAL;HARD;3;Alarm at 20
[1346424498] EXTERNAL COMMAND: SCHEDULE_FORCED_SVC_CHECK;server1;mysqld;1346424496
[1346424501] EXTERNAL COMMAND: SCHEDULE_FORCED_SVC_CHECK;server1;mysqld;1346424500
[1346424504] EXTERNAL COMMAND: SCHEDULE_FORCED_SVC_CHECK;server1;mysqld;1346424503
[1346424506] SERVICE ALERT: server1;mysqld;OK;HARD;3;Alarm at 20
[1346424508] EXTERNAL COMMAND: SCHEDULE_FORCED_SVC_CHECK;server1;mysqld;1346424506
[1346427012] EXTERNAL COMMAND: SCHEDULE_FORCED_SVC_CHECK;server1;mysqld;1346427010
[1346433633] EXTERNAL COMMAND: DISABLE_SVC_NOTIFICATIONS;server1;mysqld
[1346433689] EXTERNAL COMMAND: SCHEDULE_FORCED_SVC_CHECK;server1;mysqld;1346433688
[1346433692] EXTERNAL COMMAND: SCHEDULE_FORCED_SVC_CHECK;server1;mysqld;1346433691
[1346433697] EXTERNAL COMMAND: SCHEDULE_FORCED_SVC_CHECK;server1;mysqld;1346433695
in perfdatalog dont show anything of the server in cuestion.
i have in templates.cfg this
define host {
name host-pnp
action_url /pnp4nagios/graph?host=$HOSTNAME$&srv=_HOST_’ class=’tips’ rel=’/pnp4nagios/popup?host=$HOSTNAME$&srv=_HOST_
register 0
}
define service {
name srv-pnp
action_url /pnp4nagios/graph?host=$HOSTNAME$&srv=$SERVICEDESC$’ class=’tips’ rel=’/pnp4nagios/popup?host=$HOSTNAME$&srv=$SERVICEDESC$
register 0
}
i need to create new service to graph this?
sorry for the noobs questions lol
i already put the check_mysqld.cfg in /usr/local/pnp4nagios/etc/check_commands
and the check_mysqld.php on
/usr/local/pnp4nagios/share/templates.dist/ and
/usr/local/pnp4nagios/share/templates/
thanks!!!
Correct, you have to put the php script in the templates.dist directory and ensure that the script check_mysqld.pl is in the correct plugin directory with correct permissions (755), declare the command for Nagios and associate the service with the host that is executing MySQL. Also execute manually the mysql perl script with the user, password and host options and check is running properly. If you have many problems I recommend you to reinstall the plugin from binaries and try to configure following the steps of this post.
hi,
mkdir /usr/lib/nagios/mk-livestatus && chown nagios:apache /usr/lib/nagios/mk-livestatus
are you sure it’s not a ‘chown -R’ ?
Hi! Yes, the -R option is for recursive and in the moment of change the permissions the mk-livestatus directory is empty. Do you get any error?