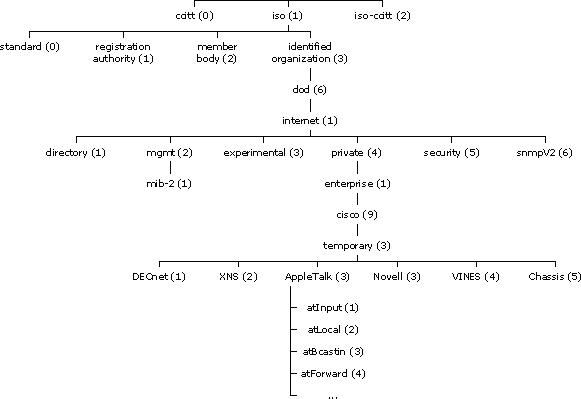
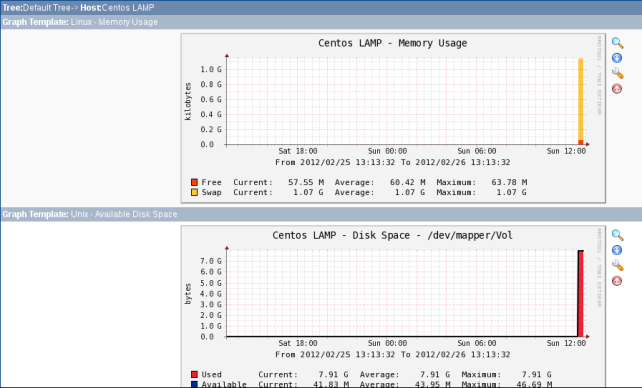
Is very important have a good tool to monitor our devices in a networking. Cacti do this and very well. Cacti offers graphs using rrdtool to monitor the load average, ping latency, disk space and other relevant information over SNMP protocol. SNMP use the UDP port 161 for read and 162 UDP for trap, and use a hierarchial database named MIB (Management Information Base). MIB is a collection of objects and variables that stores information about an agent.
In our scenario we’ll monitor two servers the NMS server and we’ll add another one to our network.
NMS SERVER CONFIG
– Install mysql, php, httpd, snmpd and cron:
# yum install mysql mysql-server httpd php-mysql php-snmp net-snmp net-snmp-utils cronie
– Configure EPEL repositories:
# rpm -ivh http://download.fedoraproject.org/pub/epel/6/i386/epel-release-6-5.noarch.rpm
# rpm --import https://fedoraproject.org/static/217521F6.txt
# yum repolist
– Auto start services:
# service mysqld start
# service http start
# service snmpd start
# service crond start
# chkconfig --levels 235 httpd on
# chkconfig --levels 235 snmpd on
# chkconfig --levels 235 mysqld on
# chkconfig --levels 235 crond on
– Install cacti:
# yum install rrdtool cacti
– Database config:
# mysql -u root mysql> create database cacti; mysql> grant all on cacti.* to 'cacti'@'localhost' identified by 'cacti'; mysql> quit; mysql -u root cacti < /usr/share/doc/cacti-0.8.7i/cacti.sql[/sourcecode] - cron poller.php: [sourcecode lang="BASH"]# vi /etc/cron.d/cacti */5 * * * * cacti php /usr/share/cacti/poller.php > /dev/null 2>&1
– web files:
# chown -R cacti:root /usr/share/cacti
# vi /usr/share/cacti/include/config.php
# vi /etc/httpd/conf.d/cacti.config
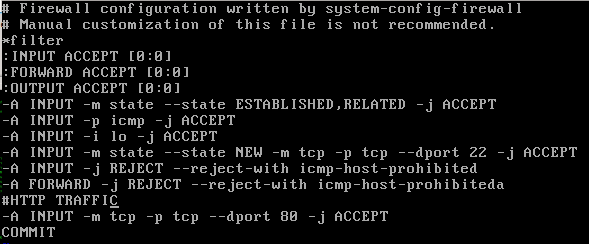
– Iptables rules for web access:
# vi /etc/sysconfig/iptables
# service iptables restart
default user/password: admin // admin
Access: http://ipserver/cacti
check all the tools are installed in our system before install cacti:
– Create graphs:
Management> Devices > device > Add
– SNMP Configuation (server client):
# yum nstall net-snmp net-snmp-utils
# chkconfig --levels 235 snmpd on
# vi /etc/snmp/snmpd.conf
# service snmpd start
# vi /etc/sysconfig/iptables
# service iptables restart
check we can collect information about this server:
# snmpwalk -v 2c -c public 192.168.1.58
– Add host cacti:
Management > Devices > Add
Create > New Graphs
Management > Graph Trees > Default Tree > Add
– Section graphs:


i have follow you all step same to same as posted by you but i am unable to load cacti web page
CACTI – Blank Page / unable to load
please reply in my email with solution
thanks in advanced
Hello, Ivan!
Could you tell why wouldn’t my Cacti be able to determine the status of CENTOS machine? Did everything like you said, but still getting Unknown value in the Status column (@Management->Devices) and the RTT stays 0 all the time.
Regards,
Alex
I think need to restart the httpd service before or after iptables change. I also facing that problem. But after restarting the httpd, it is ok.